What is Data Wrangling and
Why is it Important for Data Analysts?

Introduction
As a data analyst, one of the most time-consuming and critical steps in the data analysis process is data wrangling. Often referred to as data cleaning or data preprocessing, this step involves transforming raw data into a clean, usable format for analysis. Data wrangling is an essential skill for any data analyst because even the best analytical models or the most advanced tools can be rendered ineffective by poor-quality data. In this blog post, we’ll explore what data wrangling is, why it’s so important, and how it helps data analysts achieve more accurate and meaningful insights.
What is Wrangling ?
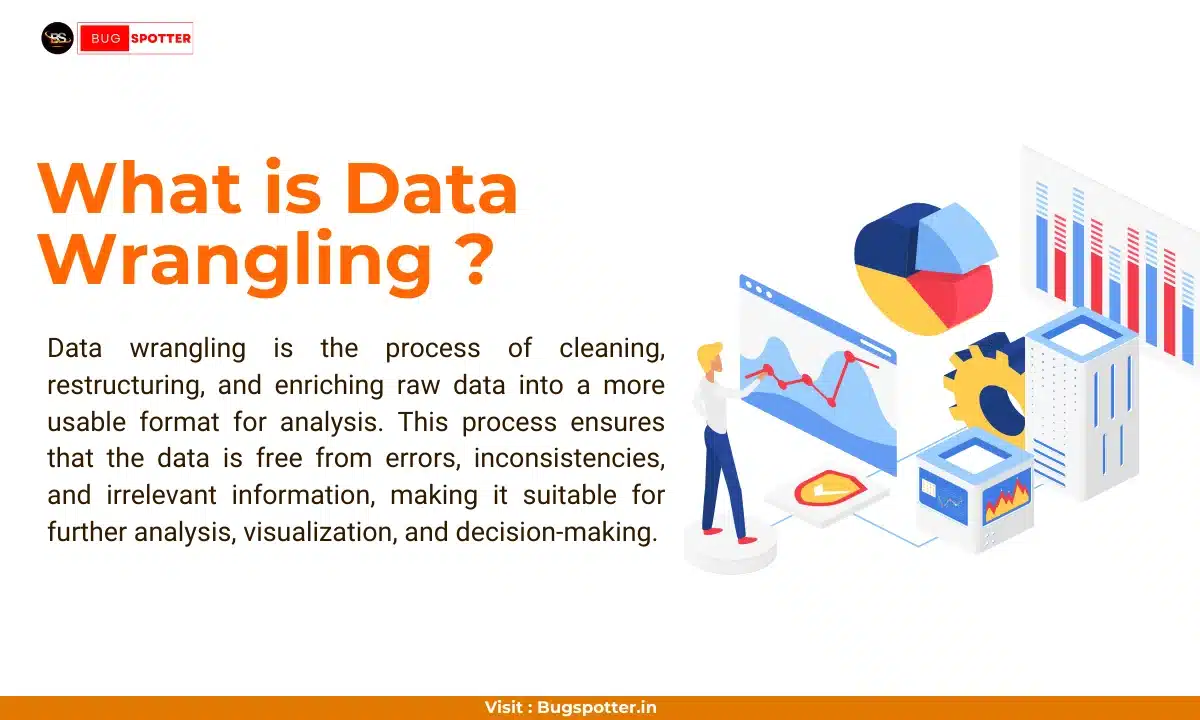
Data wrangling is the process of cleaning, restructuring, and enriching raw data into a more usable format for analysis. This process ensures that the data is free from errors, inconsistencies, and irrelevant information, making it suitable for further analysis, visualization, and decision-making.
At its core, data wrangling involves several tasks, such as:
- Data Cleaning: Removing or correcting errors, handling missing values, and addressing inconsistencies.
- Data Transformation: Converting data into the right structure, format, or type (e.g., changing date formats, normalizing data, aggregating values).
- Data Integration: Combining data from multiple sources and ensuring consistency across datasets.
- Data Reduction: Filtering out unnecessary or irrelevant data points, ensuring you’re working with only the most important data.
While data wrangling might sound simple, it can be a complex and meticulous process, especially when dealing with large datasets or data from multiple sources.
What is Wrangling Meaning ?
Data wrangling refers to the process of cleaning, transforming, and organizing raw data into a structured and usable format for analysis. It involves tasks like handling missing values, correcting errors, standardizing formats, and integrating data from different sources to ensure it is accurate and ready for analysis.
Why is Data Wrangling Important for Data Analysts?
1. Ensures Data Quality
Data wrangling is crucial because raw data is often messy. Incomplete, inconsistent, or incorrect data can easily lead to misleading conclusions. Data wrangling helps ensure that the dataset you’re working with is clean and reliable, which is the foundation for any good analysis.
For example, if you’re analyzing sales data but some entries are missing or have incorrect product IDs, your analysis of sales performance might be skewed. Cleaning and correcting these errors ensures that your results are trustworthy.
2. Improves Data Accuracy
When data is cleaned and transformed, it becomes more accurate and precise. Inconsistent formatting (like inconsistent date formats or different naming conventions) can confuse analysis tools and lead to errors. For example, if some records list “NY” and others list “New York” for a location, treating these as two separate entities could distort the analysis. Data wrangling solves these issues by standardizing data entries and making sure they align with the required format.
3. Enables Better Insights
In raw form, data may be incomplete, inconsistent, or not structured in a way that’s helpful for analysis. Data wrangling allows you to reshape data to reveal patterns, trends, and relationships that would otherwise be hidden. For instance, if you’re working with data in different units (e.g., some measurements are in pounds and others in kilograms), converting all values into the same unit allows for more meaningful comparisons.
By carefully cleaning and structuring the data, you can unearth hidden insights that drive decision-making, such as discovering trends in customer behavior, identifying operational inefficiencies, or predicting future outcomes.
4. Saves Time in the Long Run
Though data wrangling can be time-consuming at first, it saves time in the long run by reducing the need for repetitive adjustments later in the analysis process. When data is properly cleaned and structured from the start, it ensures smoother transitions to the analysis phase. Moreover, by addressing potential issues early on, you minimize the chances of having to go back and rework your analysis due to overlooked data problems.
5. Ensures Compatibility with Analysis Tools
Data wrangling is essential for ensuring that your data is compatible with the tools and algorithms you’ll use in the analysis phase. For example, machine learning algorithms require data in specific formats, and any inconsistencies could cause the algorithms to break or produce incorrect predictions. Data wrangling addresses such challenges, ensuring that your data is in a form that can be easily ingested by analysis tools like Excel, SQL databases, Tableau, or machine learning models.
Common Data Wrangling Tasks Every Data Analyst Must Know
1. Handling Missing Data
- Problem: Missing values are a common issue in real-world datasets. If not handled properly, they can distort analysis results.
- Solution: Use techniques like imputation (filling in missing values with the mean, median, or a predictive model) or removal (excluding rows with missing data).
2. Removing Duplicates
- Problem: Duplicate records in datasets can inflate figures or skew results.
- Solution: Identify and remove duplicate rows to ensure the dataset represents unique records.
3. Standardizing Data Formats
- Problem: Different data sources may use different formats (e.g., date formats or currency units).
- Solution: Convert data into a consistent format (e.g., converting “MM/DD/YYYY” to “YYYY-MM-DD” or changing all currency values to a single currency).
4. Converting Categorical Data
- Problem: Categorical data may be in text format, making it difficult to analyze.
- Solution: Use techniques like one-hot encoding or label encoding to convert categorical data into numeric formats.
5. Outlier Detection
- Problem: Outliers can heavily distort statistical analysis and predictive models.
- Solution: Identify outliers using statistical techniques (like z-scores or IQR) and decide whether to remove or adjust them based on their impact.
Tools and Techniques for Data Wrangling
While data wrangling can be performed manually in tools like Excel, there are more advanced methods and tools to help automate the process:
- Python: Libraries like pandas and NumPy offer powerful functionalities to clean, transform, and analyze data.
- R: R has several data wrangling packages like dplyr and tidyr that allow data analysts to manipulate data with ease.
- SQL: Data wrangling tasks like removing duplicates, filtering data, and aggregating can be performed directly in databases using SQL queries.
- Tableau Prep: A visual data preparation tool that helps analysts clean and structure data before bringing it into Tableau for analysis.
Data Wrangling with Python
Python has become one of the most widely used programming languages for data wrangling due to its powerful libraries and simplicity. Python offers a variety of tools to clean, transform, and manipulate data, making it easier for data analysts to work with raw datasets and prepare them for analysis.
Here are some key topics in data wrangling with Python:
1. Pandas Library
- Pandas is the go-to Python library for data wrangling. It provides powerful data structures like DataFrames and Series that allow you to efficiently manipulate and analyze data.
- Data Cleaning with Pandas: Use pandas to handle missing values, remove duplicates, and filter data. Functions like
.dropna(),.fillna(), and.drop_duplicates()are commonly used to clean datasets. - Data Transformation: Pandas allows for easy transformation of data. You can aggregate data, merge multiple datasets, and apply functions to columns using
.groupby(),.merge(), and.apply(). - Handling Categorical Data: Categorical data often needs to be encoded for analysis. In Python, you can use
pd.get_dummies()to convert categorical variables into dummy/indicator variables, or useLabelEncoderfor encoding labels as numbers.
2. NumPy Library
- NumPy is essential when working with numerical data. It provides a multi-dimensional array object, which is perfect for handling large datasets efficiently.
- You can perform mathematical operations like normalizing data, filling missing values, and transforming data using NumPy arrays.
3. Regular Expressions (Regex)
- When cleaning text data, regular expressions are invaluable for searching and replacing patterns in data. For example, you can use regex to remove unwanted characters, extract specific information, or format text in a consistent way.
4. Data Aggregation and Grouping
- Using pandas and NumPy, you can group data by certain categories and perform aggregation functions, such as summing or averaging values. For example, you could group sales data by region and calculate the total sales per region.
5. Merging and Joining Data
- Python makes it easy to combine data from multiple sources using merge(), concat(), and join() functions in pandas. These functions allow you to perform SQL-style joins to combine data based on common columns, which is essential for working with datasets that come from different sources.
6. Handling Missing Data
- Missing data is common in raw datasets. Python offers several methods for handling missing values, such as imputation (filling missing values with the mean, median, or mode) and removing records with missing values using
.dropna().
Latest Posts
- All Posts
- Software Testing
- Uncategorized


Categories
- Artificial Intelligence (5)
- Best IT Training Institute Pune (9)
- Cloud (2)
- Data Analyst (55)
- Data Analyst Pro (15)
- data engineer (18)
- Data Science (104)
- Data Science Pro (20)
- Data Science Questions (6)
- Digital Marketing (4)
- Full Stack Development (7)
- Hiring News (41)
- HR (3)
- Jobs (3)
- News (1)
- Placements (2)
- SAM (4)
- Software Testing (70)
- Software Testing Pro (8)
- Uncategorized (33)
- Update (33)
Tags
- Artificial Intelligence (5)
- Best IT Training Institute Pune (9)
- Cloud (2)
- Data Analyst (55)
- Data Analyst Pro (15)
- data engineer (18)
- Data Science (104)
- Data Science Pro (20)
- Data Science Questions (6)
- Digital Marketing (4)
- Full Stack Development (7)
- Hiring News (41)
- HR (3)
- Jobs (3)
- News (1)
- Placements (2)
- SAM (4)
- Software Testing (70)
- Software Testing Pro (8)
- Uncategorized (33)
- Update (33)


