Time Series Analysis
Introduction
In the world of data analysis, time series analysis stands out as one of the most powerful techniques for making sense of data that changes over time. From forecasting stock prices to predicting weather patterns, time series analysis provides critical insights across various industries. In this blog, we will dive into what time series analysis is, its components, and how to perform it, along with some real-world applications.
What is Time Series Analysis?
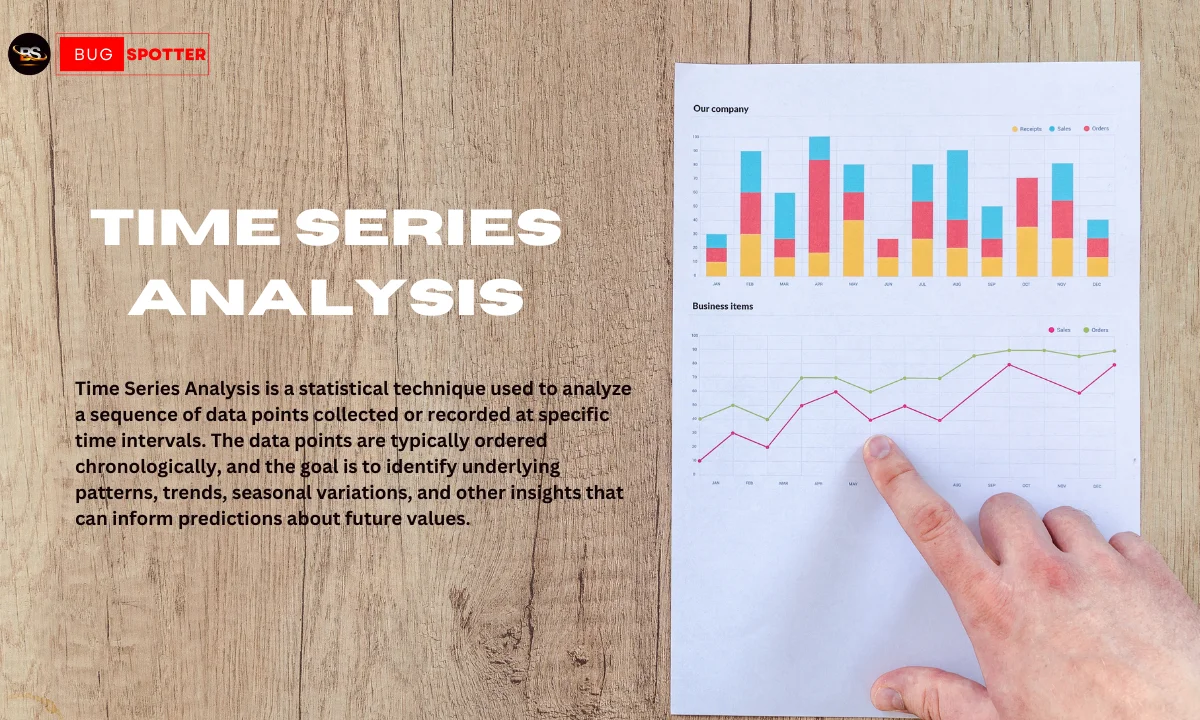
Time series analysis is the process of analyzing data points collected or recorded at specific time intervals. Unlike traditional data, which may not follow any inherent order, time series data is indexed by time, making it unique in the sense that it reveals underlying patterns over time. These patterns may include trends, seasonality, and cyclical behaviors, which are critical to understanding the temporal dynamics of the data.
A time series can range from simple daily temperature readings to complex minute-by-minute stock market movements. The primary goal of time series analysis is to extract meaningful insights from the data, identify trends, forecast future data points, and build predictive models.
Key Components of Time Series Data:
1.Trend:
- The trend refers to the long-term movement in data, which can be upward, downward, or remain flat. Trends often reflect broader, more persistent changes in the data due to factors like economic growth, technological advancements, or societal shifts.
2.Seasonality:
- Seasonality represents regular and predictable patterns or cycles in the data over fixed periods such as daily, weekly, monthly, or yearly. For example, retail sales might see an increase during holiday seasons like Christmas or Black Friday, which represents a seasonal pattern.
3.Noise:
- Noise in a time series refers to random variations or irregularities in the data that cannot be attributed to trends or seasonality. This may be due to unpredictable events or small-scale fluctuations that do not follow a recognizable pattern.
4.Cyclic Patterns:
- These patterns occur at irregular intervals and are typically influenced by economic, political, or other external factors. Unlike seasonality, which occurs at regular intervals, cycles are not as predictable and can span long durations (e.g., economic booms and recessions).
Steps to Perform Time Series Analysis:
1.Collect Data:
- The first step in time series analysis is to gather the time-based data, which could come from various sources like sensors, financial transactions, weather recordings, or website traffic logs.
2.Plot the Data:
- Visualizing the data is the next critical step. Plotting the time series data allows you to observe its structure, including trends, seasonality, and any outliers or anomalies.
3.Decompose the Time Series:
- Decomposition involves breaking down the time series into its individual components—trend, seasonality, and residuals (noise). This step is vital for understanding the contribution of each component to the overall behavior of the data.
4.Stationarity Check:
- For many time series models to work properly, the data must be stationary. Stationarity means that statistical properties like the mean and variance should remain constant over time. If a time series is non-stationary, techniques such as differencing or logarithmic transformations can be applied to make it stationary.
5.Model Selection:
- Based on the characteristics of the time series, different models can be chosen for analysis and forecasting:
- ARIMA (AutoRegressive Integrated Moving Average): A popular model for forecasting stationary time series by considering past values (autoregression), the trend (differencing), and past forecast errors (moving average).
- Exponential Smoothing (ETS): This model assigns exponentially decreasing weights to past observations and is effective for series with trends and seasonality.
- Seasonal Decomposition of Time Series (STL): A robust method for decomposing time series data into its trend, seasonal, and residual components.
- Prophet: A forecasting tool developed by Facebook, ideal for data with strong seasonal patterns, especially in business and financial time series.
6.Model Evaluation:
- After fitting a model, it’s essential to assess its performance using metrics like:
- Mean Absolute Error (MAE): The average absolute difference between the observed values and the predicted values.
- Root Mean Squared Error (RMSE): The square root of the average squared differences between the predicted and observed values.
- Mean Absolute Percentage Error (MAPE): A percentage-based metric that expresses the accuracy of the forecast relative to the observed values.
7.Forecasting:
- After the model has been trained and validated, it can be used to forecast future values in the time series. Forecasting is the primary goal of time series analysis and finds applications in various fields such as finance, healthcare, economics, and more.
Common Time Series Forecasting Models:
1.ARIMA (AutoRegressive Integrated Moving Average):
ARIMA is one of the most widely used models for time series forecasting. It combines autoregressive (AR) and moving average (MA) components with differencing (I) to make non-stationary data stationary. ARIMA is powerful for forecasting stationary data but needs modifications for seasonality.
2.Seasonal ARIMA (SARIMA):
SARIMA extends the ARIMA model by including seasonal components, which is useful when time series data exhibits strong seasonal patterns, such as retail sales data.
3.Exponential Smoothing (ETS):
The Exponential Smoothing method assigns exponentially decreasing weights to older observations. This model is particularly useful for time series with strong trends and seasonal components.
4.Prophet:
Prophet is a forecasting tool that is easy to use and robust to missing data and outliers. It’s particularly useful for business forecasting tasks, such as predicting website traffic or sales.
Applications of Time Series Analysis:
1.Finance:
Time series analysis is heavily used in finance for stock market prediction, portfolio management, economic forecasting, and risk assessment. Traders rely on historical data to forecast future price movements.
2.Healthcare:
In healthcare, time series can be used to track patient vital signs, predict disease outbreaks, or analyze hospital operations over time.
3.Weather Forecasting:
Meteorologists utilize time series data to predict weather conditions, track climate change, and forecast extreme weather events based on historical patterns.
4.Sales and Marketing:
Businesses use time series analysis to forecast sales, optimize inventory management, and plan marketing strategies based on historical performance.
5.Energy Consumption:
Utilities apply time series forecasting to predict energy demand, helping them to optimize resources and reduce costs.
Latest Posts
- All Posts
- Software Testing
- Uncategorized


Software Services
Good draw knew bred ham busy his hour. Ask agreed answer rather joy nature admire.
Categories
- Artificial Intelligence (5)
- Best IT Training Institute Pune (9)
- Cloud (2)
- Data Analyst (55)
- Data Analyst Pro (15)
- data engineer (18)
- Data Science (104)
- Data Science Pro (20)
- Data Science Questions (6)
- Digital Marketing (4)
- Full Stack Development (7)
- Hiring News (41)
- HR (3)
- Jobs (3)
- News (1)
- Placements (2)
- SAM (4)
- Software Testing (70)
- Software Testing Pro (8)
- Uncategorized (33)
- Update (33)
Tags
- Artificial Intelligence (5)
- Best IT Training Institute Pune (9)
- Cloud (2)
- Data Analyst (55)
- Data Analyst Pro (15)
- data engineer (18)
- Data Science (104)
- Data Science Pro (20)
- Data Science Questions (6)
- Digital Marketing (4)
- Full Stack Development (7)
- Hiring News (41)
- HR (3)
- Jobs (3)
- News (1)
- Placements (2)
- SAM (4)
- Software Testing (70)
- Software Testing Pro (8)
- Uncategorized (33)
- Update (33)