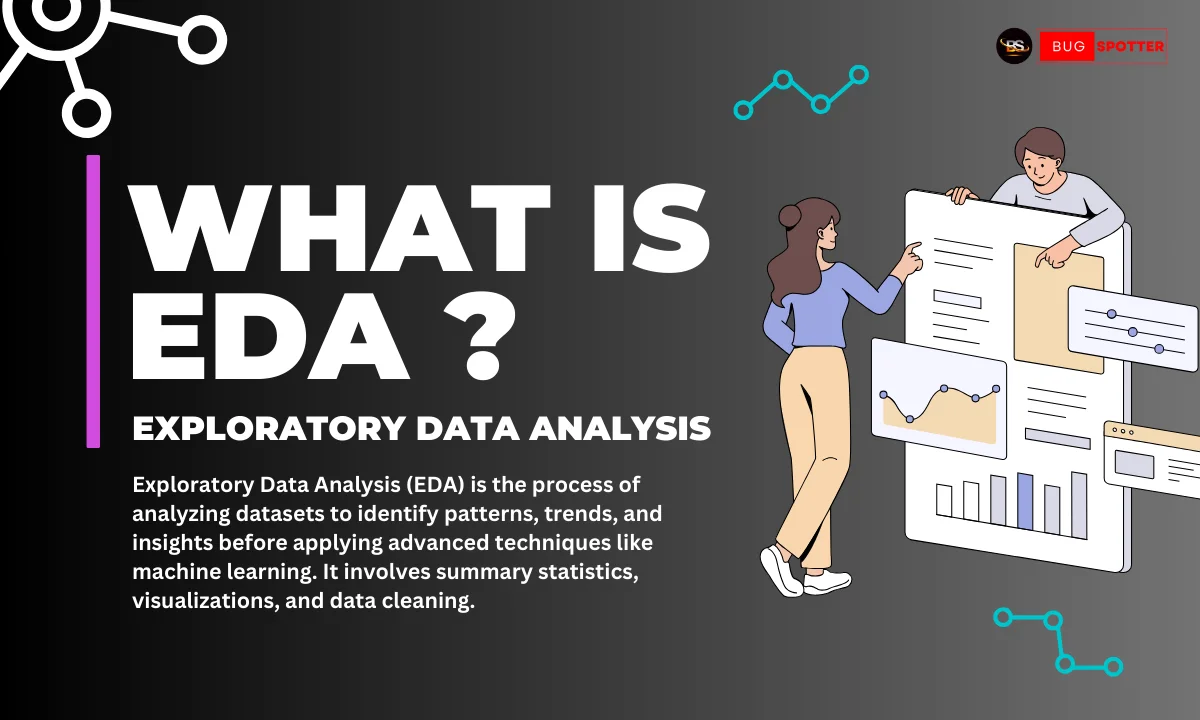
1. What is Exploratory Data Analysis (EDA)?
EDA is the process of analyzing a dataset to summarize its main characteristics, often using visual methods. It helps in understanding the data’s structure, identifying patterns, detecting outliers, and discovering relationships between variables.
2. Why is EDA important?
EDA is crucial because it provides insights into the data before applying advanced techniques like statistical modeling or machine learning. It helps detect data quality issues, formulate hypotheses, and choose the right analysis techniques.
3. What are the main goals of EDA?
The main goals of EDA are to understand the data, identify patterns or trends, detect data quality issues (like missing values or outliers), and formulate hypotheses for further analysis or modeling.
4. What techniques are commonly used in EDA?
Common techniques include:
- Summary statistics: Mean, median, standard deviation, etc.
- Data visualization: Histograms, scatter plots, box plots, bar charts, etc.
- Data cleaning: Handling missing values, duplicates, and outliers.
- Data transformation: Normalization and encoding.
5. What is the difference between descriptive statistics and EDA?
Descriptive statistics summarize the dataset through numerical measures like mean and standard deviation, whereas EDA uses both statistics and visualization to explore the data, uncover patterns, and spot issues.
6. What are some common visualizations used in EDA?
Popular visualizations in EDA include:
- Histograms: For understanding the distribution of a single variable.
- Box plots: To identify outliers and understand the spread of data.
- Scatter plots: To observe relationships between two variables.
- Bar charts: For comparing categorical data.
7. What are outliers, and why are they important in EDA?
Outliers are data points that differ significantly from other observations. In EDA, they are important because they can distort statistical analyses, lead to incorrect conclusions, or point to data entry errors or rare events.
8. What is the role of data cleaning in EDA?
Data cleaning is a key part of EDA, as it involves handling missing values, removing duplicates, and fixing inconsistencies. Cleaning ensures that the data is accurate and reliable for further analysis.
9. How does EDA help in feature selection?
EDA helps identify which features (variables) are important by analyzing relationships and correlations between them. It also helps identify redundant or irrelevant features that can be dropped, improving model performance.
10. How does EDA handle missing data?
During EDA, missing data can be handled in several ways:
- Imputation: Filling missing values with statistical measures (mean, median, or mode).
- Deletion: Removing rows or columns with too many missing values.
- Prediction: Using machine learning models to predict and fill in missing data based on other features.


