What is P-Value in Statistical Hypothesis Testing

Introduction
In the world of statistics, the p-value is one of the most frequently discussed concepts when it comes to hypothesis testing. Whether you are analyzing data for a scientific study, conducting a market research experiment, or evaluating business trends, understanding the p-value can be crucial for drawing valid conclusions. But what exactly is the p-value? In this blog post, we will explore what the p-value is, how it is used in statistical hypothesis testing, and why it’s important to interpret it correctly.
What is P-Value in Statistics?
In statistical hypothesis testing, the p-value is a fundamental concept used to determine the strength of evidence against the null hypothesis. It represents the probability of observing a test statistic as extreme as, or more extreme than, the result obtained from the data, assuming that the null hypothesis is true. Essentially, it helps us assess whether the results of an experiment or study are statistically significant or if they could have occurred by random chance.
What is the P-Value?
The p-value is a continuous number between 0 and 1 that quantifies the evidence against the null hypothesis. It gives a measure of how consistent your data is with the null hypothesis. The smaller the p-value, the greater the evidence against the null hypothesis.
- A p-value close to 0: Suggests strong evidence against the null hypothesis, implying that the null hypothesis is likely false.
- A p-value close to 1: Indicates weak evidence against the null hypothesis, suggesting that the null hypothesis is likely true.
P-Value Formula
The p-value depends on the test statistic that you calculate from your data. There isn’t a single “formula” for the p-value since it varies depending on the type of hypothesis test you are conducting (e.g., t-test, chi-square test, z-test, etc.). However, the general approach is to:
- Calculate the test statistic based on your sample data.
- Determine the probability of obtaining a test statistic as extreme as the observed value under the null hypothesis.
For example, in a one-sample z-test, the p-value can be calculated from the z-score, which is obtained from the formula:
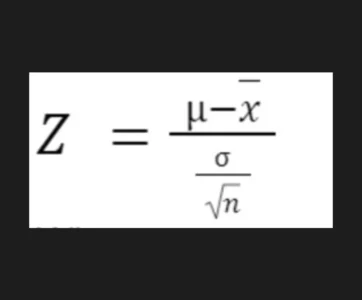
Where:
- xˉ\bar{x}xˉ is the sample mean,
- μ\muμ is the population mean,
- σ\sigmaσ is the population standard deviation,
- nnn is the sample size.
Once you calculate the z-score, you can use standard statistical tables or software to find the p-value corresponding to that z-score.
How to Calculate P-Value
To calculate the p-value, follow these general steps:
State your hypotheses:
- Null hypothesis (H₀): There is no effect or difference.
- Alternative hypothesis (H₁): There is an effect or difference.
Choose the significance level (α): Typically, this is set at 0.05, but it can vary depending on the context of your study.
Select the appropriate statistical test based on your data (e.g., t-test, chi-square test, ANOVA).
Calculate the test statistic: Depending on the test, you’ll compute a statistic (like a t-statistic or z-score) from your sample data.
Find the p-value: Using statistical tables or software, find the p-value that corresponds to your test statistic. Alternatively, some statistical software will calculate the p-value directly for you.
Compare the p-value with the significance level (α):
- If the p-value ≤ α, reject the null hypothesis (indicating evidence in favor of the alternative hypothesis).
- If the p-value > α, fail to reject the null hypothesis (indicating insufficient evidence for the alternative hypothesis).
Interpreting the P-Value
The p-value is a continuous value that ranges from 0 to 1. The interpretation of the p-value depends on the level of significance (α), often set at 0.05 in many fields. Here’s how to interpret the p-value:
P-value ≤ α (Typically 0.05): If the p-value is less than or equal to the chosen significance level (often 0.05), we reject the null hypothesis. This suggests that the data provides strong enough evidence to support the alternative hypothesis. In other words, the results are statistically significant.
P-value > α: If the p-value is greater than the chosen significance level, we fail to reject the null hypothesis. This means that the evidence against the null hypothesis is not strong enough, and we conclude that there is no significant effect or relationship in the data.
For example, if you are testing whether a new drug is more effective than a placebo, and you get a p-value of 0.03 with an α of 0.05, you would reject the null hypothesis, indicating that the drug likely has a statistically significant effect. However, if the p-value were 0.10, you would fail to reject the null hypothesis, meaning there’s not enough evidence to say the drug is more effective.
Common Misunderstandings About P-Values
The p-value is not the probability that the null hypothesis is true. The p-value tells you how consistent your data is with the null hypothesis, but it does not directly indicate the probability of the null hypothesis itself being true. It simply provides evidence against it.
A small p-value doesn’t prove the alternative hypothesis. A small p-value suggests that the null hypothesis is unlikely, but it doesn’t prove that the alternative hypothesis is true. There may still be other explanations for your results.
P-value does not tell you the size or importance of an effect. A p-value only tells you if the effect is statistically significant, but it doesn’t provide any information about how large or important that effect is. For example, a tiny p-value from a huge dataset could still represent a negligible effect in practical terms.
P-value is not an all-or-nothing decision. A p-value is a tool for assessing the strength of evidence, but it doesn’t give you a definitive conclusion. Research findings should always be considered in context and along with other supporting evidence.
What Influences the P-Value?
Several factors can influence the p-value in hypothesis testing:
Sample Size (n): A larger sample size generally leads to a smaller p-value if there is an actual effect because larger samples provide more accurate estimates. However, it’s important to ensure that the effect is meaningful, not just statistically significant.
Effect Size: The magnitude of the effect being tested affects the p-value. Larger effects are more likely to result in smaller p-values.
Variability in the Data: High variability in the data can make it harder to detect an effect, leading to higher p-values. In contrast, lower variability can make differences more apparent, reducing the p-value.
Limitations of the P-Value
While the p-value is a valuable statistical tool, it has its limitations:
Doesn’t prove causality: Even with a low p-value, we cannot definitively conclude that one variable causes another. Other factors could be at play.
Dependence on sample size: A large enough sample size might lead to a small p-value even if the effect is trivial or meaningless in practical terms.
Over-reliance on a cutoff: Using a fixed threshold like 0.05 for significance can sometimes lead to over-interpreting results. Researchers might treat anything below this threshold as a “success,” even if the findings are not practically important.
Latest Posts
- All Posts
- Software Testing
- Uncategorized


Categories
- Artificial Intelligence (5)
- Best IT Training Institute Pune (9)
- Cloud (2)
- Data Analyst (55)
- Data Analyst Pro (15)
- data engineer (18)
- Data Science (104)
- Data Science Pro (20)
- Data Science Questions (6)
- Digital Marketing (4)
- Full Stack Development (7)
- Hiring News (41)
- HR (3)
- Jobs (3)
- News (1)
- Placements (2)
- SAM (4)
- Software Testing (70)
- Software Testing Pro (8)
- Uncategorized (33)
- Update (33)
Tags
- Artificial Intelligence (5)
- Best IT Training Institute Pune (9)
- Cloud (2)
- Data Analyst (55)
- Data Analyst Pro (15)
- data engineer (18)
- Data Science (104)
- Data Science Pro (20)
- Data Science Questions (6)
- Digital Marketing (4)
- Full Stack Development (7)
- Hiring News (41)
- HR (3)
- Jobs (3)
- News (1)
- Placements (2)
- SAM (4)
- Software Testing (70)
- Software Testing Pro (8)
- Uncategorized (33)
- Update (33)