Logical Program for python
Power BI
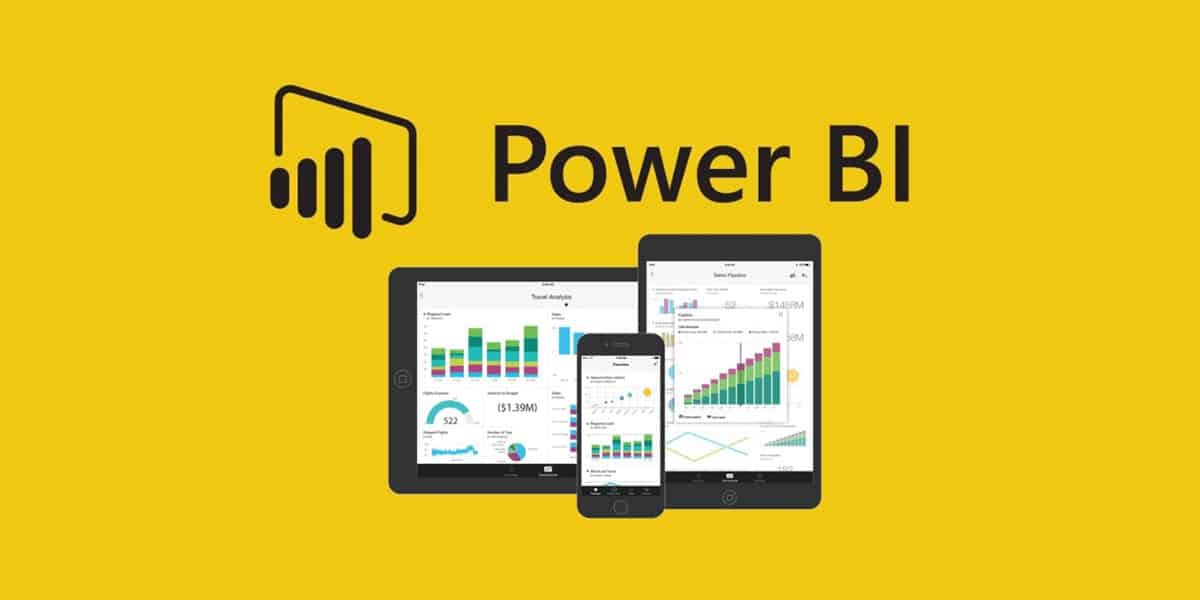
Power BI is a powerful business intelligence (BI) tool developed by Microsoft that enables users to connect, analyze, and visualize data from various sources. It transforms raw data into interactive reports and dashboards, providing valuable insights that help businesses make data-driven decisions. Whether your data is stored in Excel, cloud-based applications, or on-premises databases, Power BI integrates seamlessly with multiple data sources to create meaningful analytics.

The Components of Power BI
Power BI is a suite of tools that work together to provide end-to-end business intelligence solutions. The primary components include:
Power BI Desktop – A Windows application used for creating detailed reports and data visualizations.
Power BI Service – A cloud-based service that allows users to publish, share, and collaborate on reports.
Power BI Mobile – Applications available for iOS, Android, and Windows devices, enabling users to access reports on the go.
Power BI Report Builder – A tool for creating paginated reports, which are formatted to fit on a page and ideal for printing or exporting.
Power BI Report Server – An on-premises solution for organizations that need to keep their data within their own infrastructure while still leveraging Power BI’s capabilities.
Key Features of Power BI
Data Connectivity – Power BI supports connections to a vast range of data sources, including Excel, SQL Server, Azure, Google Analytics, SharePoint, and many more.
Data Transformation – The Power Query Editor allows users to clean, transform, and model data before visualization.
Interactive Dashboards – Users can create highly interactive dashboards with drag-and-drop features and customizable visuals.
AI and Machine Learning Integration – Power BI integrates with Azure AI services, enabling predictive analytics and automated insights.
Collaboration and Sharing – Users can share reports and dashboards securely within their organization or with external stakeholders.
Real-Time Analytics – Power BI enables real-time streaming of data, making it ideal for monitoring live business metrics.
Embedded Analytics – Developers can integrate Power BI reports and dashboards into their applications using Power BI Embedded.
How Power BI Works Based on Roles
Business Users: Primarily consume reports and dashboards to make data-driven decisions.
Report Creators: Use Power BI Desktop and Power Query to design reports and visualizations.
Administrators: Manage user access, security, and performance optimization.
Developers: Use Power BI APIs to integrate analytics into custom applications.
The Power BI Workflow
Connect to Data Sources – Use Power BI Desktop to import data from different sources.
Transform and Model Data – Clean and shape data using Power Query and create relationships between datasets.
Build Visualizations – Develop interactive dashboards and reports with charts, graphs, and other visuals.
Publish to Power BI Service – Share reports with colleagues by publishing them to the Power BI cloud service.
Collaborate and Share – Set up security roles, embed reports, and distribute insights to decision-makers.
Power BI and Microsoft Fabric
Power BI integrates with Microsoft Fabric, a unified data platform that combines data storage, analytics, and AI. Organizations benefit from Microsoft Fabric’s OneLake, which centralizes data storage while leveraging Power BI for powerful business intelligence insights.
Paginated Reports in Power BI
Paginated reports are designed for detailed document-style reporting, such as invoices, statements, and transcripts. These reports, created using Power BI Report Builder, can be exported as PDFs, Excel, or other formats for distribution.
Power BI and Microsoft Fabric
Organizations that require on-premises data management can use Power BI Report Server to host reports behind a firewall. This enables secure, enterprise-wide reporting while maintaining flexibility for future cloud adoption.
Categories
- Artificial Intelligence (5)
- Best IT Training Institute Pune (9)
- Cloud (2)
- Data Analyst (55)
- Data Analyst Pro (15)
- data engineer (18)
- Data Science (104)
- Data Science Pro (20)
- Data Science Questions (6)
- Digital Marketing (4)
- Full Stack Development (7)
- Hiring News (41)
- HR (3)
- Jobs (3)
- News (1)
- Placements (2)
- SAM (4)
- Software Testing (70)
- Software Testing Pro (8)
- Uncategorized (33)
- Update (33)
Tags
- Artificial Intelligence (5)
- Best IT Training Institute Pune (9)
- Cloud (2)
- Data Analyst (55)
- Data Analyst Pro (15)
- data engineer (18)
- Data Science (104)
- Data Science Pro (20)
- Data Science Questions (6)
- Digital Marketing (4)
- Full Stack Development (7)
- Hiring News (41)
- HR (3)
- Jobs (3)
- News (1)
- Placements (2)
- SAM (4)
- Software Testing (70)
- Software Testing Pro (8)
- Uncategorized (33)
- Update (33)

